




How Deep.bi reduced bench time by 34% and gained margin visibility across accounts and business units

Deep.bi could see who was busy, but not early enough to act. Synthelio surfaced bench before it formed and made margin readable by account and unit.

34% reduction in bench time in the first 8 weeks

$470K+ in annual capacity recovered

Billable utilization up from 58% to 78% team average

Challenge

Deep.bi runs client engagements across several teams and accounts. Two questions mattered operationally, and neither could be answered on time.

The first was availability. Allocation information was maintained separately from delivery activity and refreshed on a weekly rhythm, which meant the picture of who was free emerged through conversations rather than from data. Someone rolling off an engagement was typically visible a week or two after the fact. By then the bench had already formed, and the window to place that person against live demand had mostly closed.

The second was profitability, and it was the harder of the two. Individual project results could be assembled after the fact, but they could not be read together. Cost sat with finance, allocations sat with delivery, and commercial terms sat in contracts, so producing a margin figure for a project meant rebuilding it by hand. Producing one for an account, or for a business unit, meant rebuilding it several times over.

That left leadership able to review outcomes but not to compare them. Which accounts were genuinely carrying the business, which delivery areas were strongest, and where the next investment should go were questions that could be discussed but not evidenced. Both problems had the same root: the data required to answer them existed, but not in one place and not at the same time.
Solution

Deep.bi consolidated allocations, billable utilization, employee cost rates, approved time and commercial terms into a single operational dataset in Synthelio.

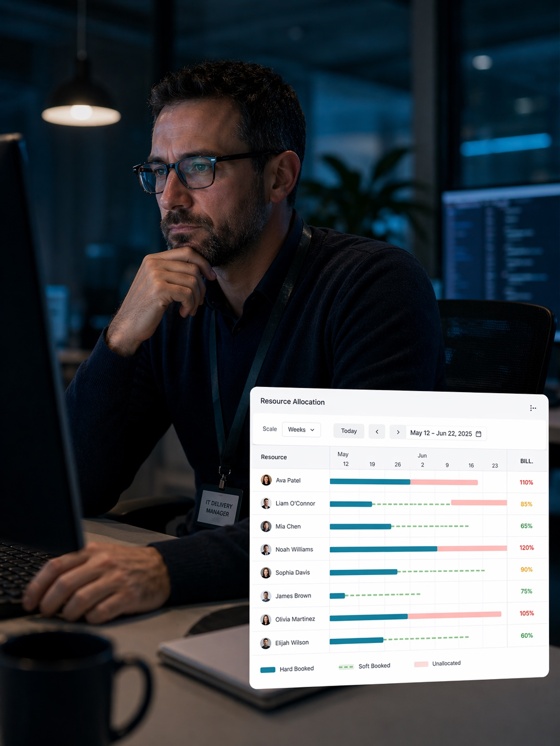
On the capacity side, allocations moved onto one rolling timeline that distinguished confirmed work from soft bookings and showed unallocated capacity without filtering or manual calculation. Delivery could see who was rolling off two, three and four weeks ahead rather than discovering it afterward. Billable utilization became a live figure per person, updated as allocations changed, with an internal threshold below which someone was flagged for attention.

Expected demand was recorded before contracts were signed, with the role, seniority, technology and required start date attached, so upcoming needs could be matched against people becoming available rather than against whoever happened to be free.

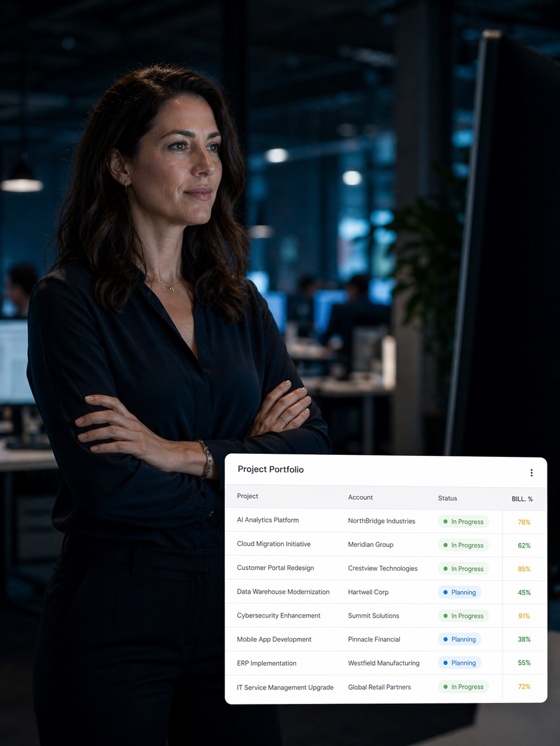
The financial layer was built on the same records. Because cost rates sat on the person and commercial terms sat on the engagement, revenue, delivery cost and margin were calculated from allocations and approved time rather than reconstructed. That made margin comparable, and comparable margin rolls up: the same figure could be read at project level by a delivery lead, at account level by the commercial team, and at business unit level by leadership, without three separate reporting exercises producing three slightly different answers.

The two layers reinforced each other. Accurate allocation data was what made the cost side trustworthy, and visible margin was what made allocation decisions commercially informed rather than purely operational.

Results

Bench time reduced by 34% in the first eight weeks

The change came from earlier visibility rather than from a different pipeline or different hiring. Bench formed where it could be seen, and it was acted on while there was still something to place people against. The average lag between someone rolling off an engagement and being reallocated fell from 11 days to 4 days.

Billable utilization rose from 58% to 78% across the team

A twenty percentage point improvement, driven by the reallocation lag closing and by weekly review shifting from asking who was available to deciding who was being placed next. Recording demand ahead of contract signature also meant that on more than one occasion the right person was identified and introduced within a day of a deal closing.

$470K+ in annual capacity recovered

Capacity that already existed and was already being paid for, converted into billable work rather than absorbed.

Margin readable by project, account and business unit

The financial view changed what leadership could ask. Rather than reviewing project outcomes one at a time after they closed, the team could compare performance across accounts and delivery areas from the same underlying data, and see which parts of the business were actually driving profitability. That turned investment and focus decisions from a matter of judgment about the recent past into a matter of reading the current portfolio.

‍

Results summary

  • Bench time reduced by 34% in the first 8 weeks
  • Billable utilization up from 58% to 78% team average
  • Average reallocation lag reduced from 11 days to 4 days
  • $470K+ in annual capacity recovered
  • Revenue, delivery cost and margin calculated per engagement from one dataset
  • Margin rolled up across projects, accounts and business units
  • Expected demand recorded before contract signature and matched to upcoming availability

What our clients say

Hear from IT solutions and consulting leaders who replaced their tool stack with Synthelio.

Book a demo

In a specialised data-engineering company, availability alone is not enough. We need to know whether the right combination of skills will be available three or six months from now. Synthelio connected future demand with planned allocations, giving sales and delivery one shared view of capacity.

Piotr Guzik
CEO

Rolling margin up across accounts and units, not just single projects, gave us a much sharper read on where we're strongest. We can double down on the areas driving profitability and make faster calls on where to invest next. It's the kind of visibility that lets a leadership team move with real confidence.

Sebastian Zontek
Founder & CEO

We already understood how our projects were progressing from a delivery perspective. What we were missing was an equally current financial picture. Synthelio connected operational and commercial data across our delivery streams, allowing us to react before a delivery issue became a margin issue.

Łukasz Dylewski
Competency Leader - Data & AI

Once we could see everyone’s allocation on a single timeline and tell soft bookings from confirmed work at a glance, everything changed. We stopped over-promising on staffing, and our bench time dropped in the first quarter.

Greg Okon
CEO

We can find the right people by role, seniority, and tech in minutes instead of digging through folders of CVs. Responding fast stopped being a fire drill.

Wiktor Tarnawski
Co-Founder & CEO